Talking Tech: Where Did Those Numbers Come From?
Let’s Talk Tech.
Accordion’s “Talking Tech” series explores how different CFO Technology solutions can empower finance functions to support organizational strategic initiatives – by implementing business process recommendations, optimizing operations, and capitalizing on value creation opportunities.
Now, let’s take a look at Anaplan in the context of organizational planning efforts.
Analysts typically spend several weeks, if not months, gathering data and KPIs to present. The question then becomes: how can planners better prepare to quickly respond and communicate the origin of their numbers, underlying assumptions, or the impact of last minute planning strategies/maneuvers? Using Anaplan lets you make the most out of your organization’s data, because it allows teams to strategize and collaborate at all levels of the organization. By enabling analysts and leaders to quickly identify trends, visualize insights and highlight the impact of adjustments in real time, Anaplan demystifies the planning process and helps businesses more accurately plan with its auditable, cloud-based platform. In this blog, we’ve identified three ways that Anaplan optimizes organizational planning efforts – agile planning methodologies, simple syntax, as well as its user experience.
Agile Planning
With next gen planning tools like Anaplan, businesses have more visibility into business unit planning, organizational assumptions, and scenario outcomes, resulting in greater connectivity across the company.
Traditionally, planning teams build bottom-up, stand-alone forecasts that are unintentionally disconnected from strategic plans. However, with Anaplan, numbers and plans flow through all levels of a business in real time, enabling teams to more accurately plan and meet company-wide strategic goals every time.
The socioeconomic impact of COVID-19 on the global economy has highlighted the need for organizations to be able to react quickly to changes without disruption and mitigate, if not obviate, any exposure to risk. Anaplan’s cloud-based technology was built in a way that champions cross collaboration, unified planning, and accountability. Business units can use Anaplan’s functionality to model dynamic scenarios, adjust their plans, and seamlessly share resulting data. This results in tighter supply chain management, greater operational oversight and forecast accuracy. Anaplan’s connected and transparent planning methodology equips decision makers with the latest numbers, plans, and assumptions to better meet strategic targets set by leadership.
Simple Syntax & Roles
Additionally, with Anaplan, leaders can empower those closest to data by providing them with an easy to use, auditable tool that gives individual teams more control and greater insight into their own numbers and plans. Business users are encouraged to become model builders so that they can create, maintain, and improve their Anaplan models. The models use formulas and functions that are written in simple syntax so that even model builders without any coding experience can succeed.
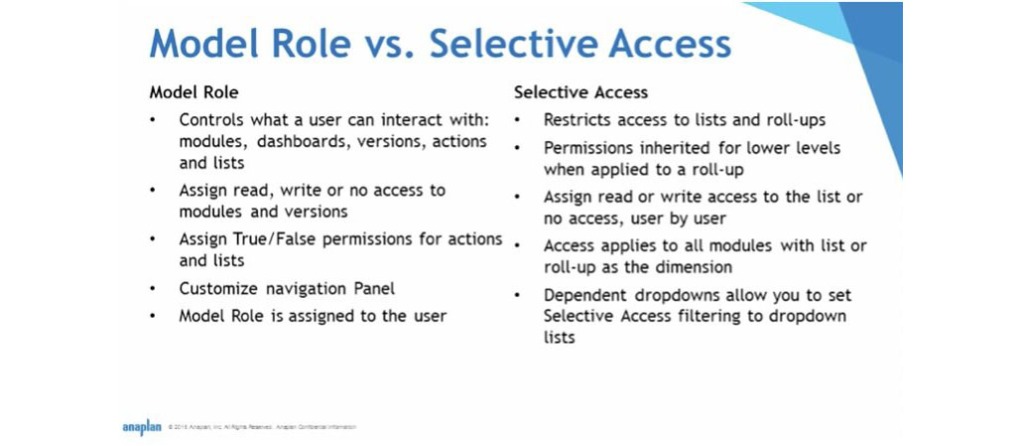
However, not just anyone can make changes in Anaplan. The security settings and role features allow companies to restrict user access, ensuring that only designated end users will be able to make adjustments in Anaplan with controlled access, protection and transparency.
The User Experience (UX)
The platform’s digital user experience further enriches the day-to-day planning and reporting. In an easy to navigate and unobstructed dashboard, end users can participate in planning and execute agile planning strategies with the ability to effortlessly edit data and immediately see the impact of their adjustments. Revisions instantly flow through the model, and essentially all users with approved access will see the updates and changes flow into their customized view. This ensures that everyone’s on the same page and operating under the same assumptions.
The dashboards are formatted to provide users with a desktop or a mobile view, ensuring that users are able to see personalized dashboards, real time data and the impact of scenario plans when they need it most. Anaplan’s collection of tables, charts, and graphs aid planners with their continuous planning by providing them with real time information visualizations that reflect their fluctuating plans and forecasts. These custom visuals not only add color to dashboards, but they also help model builders communicate trends and scenarios in ways that better inform planning and strategic efforts. Users can easily export saved views, charts, and tables for reports, and if there are any questions about the data, users can message or leave comments for planning teams in the Anaplan ecosystem.
The dashboards can also act as a landing page for end users to initiate data integrations that enable Anaplan to connect with other Anaplan models, ERM solutions or visual analysis tools. Anaplan makes it easy to schedule imports to run during off-peak times or the imports can be initiated with a click of a button.
Decision Making
With a better understanding of underlying assumptions, scenario outcomes, and current trends, business leaders will no longer be preoccupied with questions like “where did those numbers come from?” Anaplan’s cloud-based solution allows businesses to manipulate their data in real time to adapt, transform and reinvent their organization which, in turn, means that teams can spend their nights counting sheep instead of counting data points.