Talking Tech: Integrating Anaplan with Tableau in 3 Simple Steps
Meet the Author

Let’s Talk Tech.
Accordion’s “Talking Tech” series explores how different CFO Technology solutions can empower finance functions to support organizational strategic initiatives – by implementing business process recommendations, optimizing operations, and capitalizing on value creation opportunities.
Now, let’s take a look at how you can integrate Anaplan with Tableau in three simple steps.
Does your company use Anaplan for planning, with Tableau for reporting? Well you’re in luck! Tableau offers a seamless connection to Anaplan without any customization or coding.
Comparing Tableau and Anaplan would be like comparing apples and oranges. Tableau, at its core, is a data visualization tool, whereas Anaplan is a connected planning tool. When the tools are used together, the results are powerful! Anaplan’s cloud-based platform can streamline collaborated planning across an organization, and Tableau can make the resulting plans and data consumable across all levels of an organization.
Here’s how to set up your Anaplan connection to Tableau in 3 simple steps:
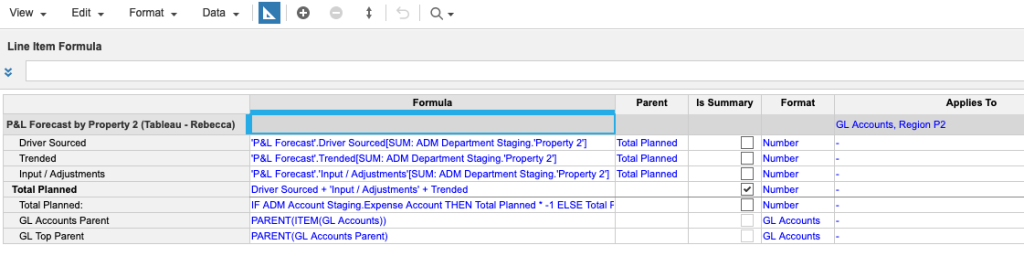
1. Setup your Anaplan Model
Select the data set (module) you want to analyze. To allow you to see the hierarchies built in your Anaplan model in your Tableau analysis – the organizational rollups, for example – you must flatten the hierarchy to show parent information. In Anaplan, we achieve this by creating additional line items that represent the parent information in the hierarchy. Now, use the Anaplan function, ‘PARENT’, to retrieve the parent information into the line item as you can see below.
Once the data is in a flat format, create a saved export definition in Anaplan. This is as simple as defining the data set (module) and setting up an action for it.
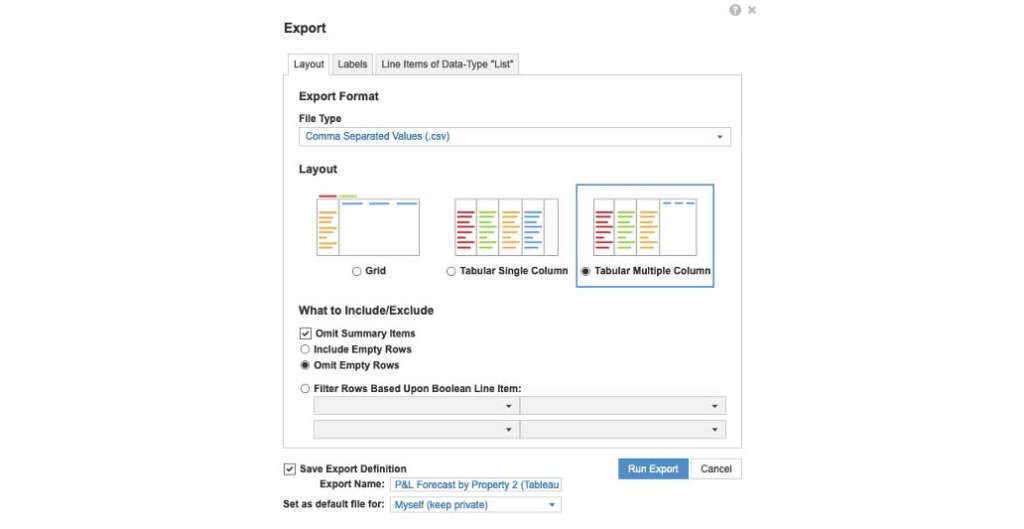
Now, you will be able to connect to that dataset in Tableau.
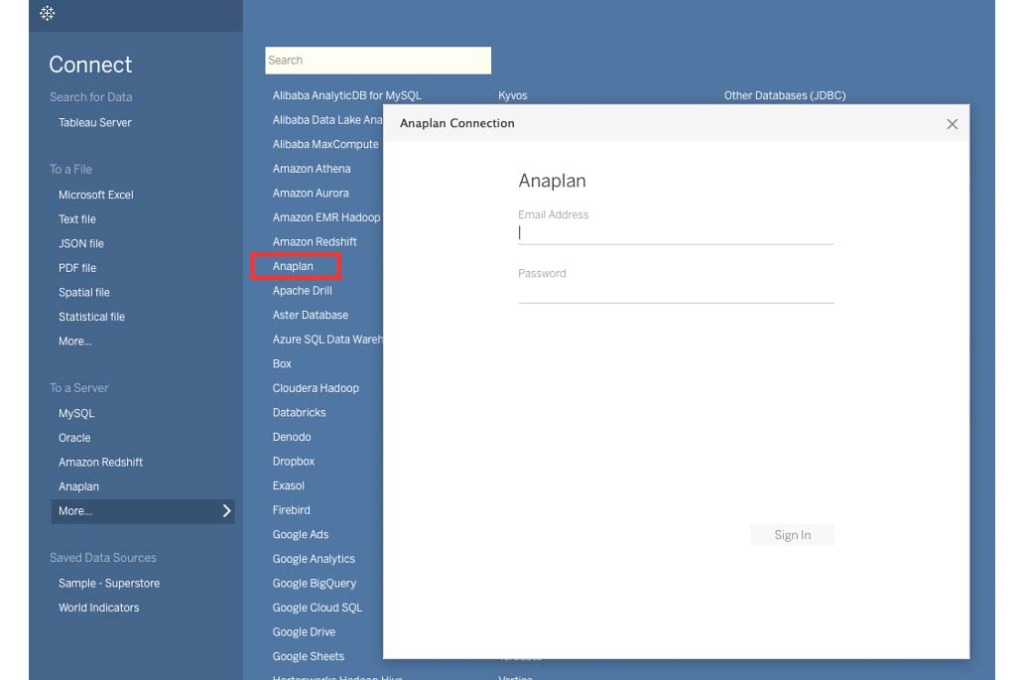
2. Connect Anaplan to Tableau
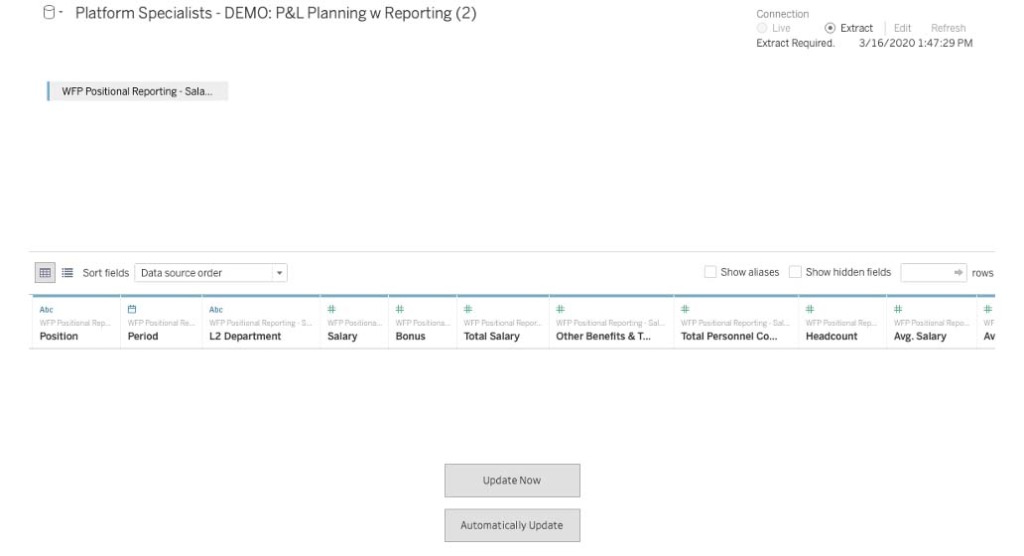
Once the export definition has been saved, open the Tableau desktop and connect to the Anaplan Server. Log on using your Anaplan credentials.
Now that you are signed in, you are able to select the workspace, model, and export definition you have saved earlier.
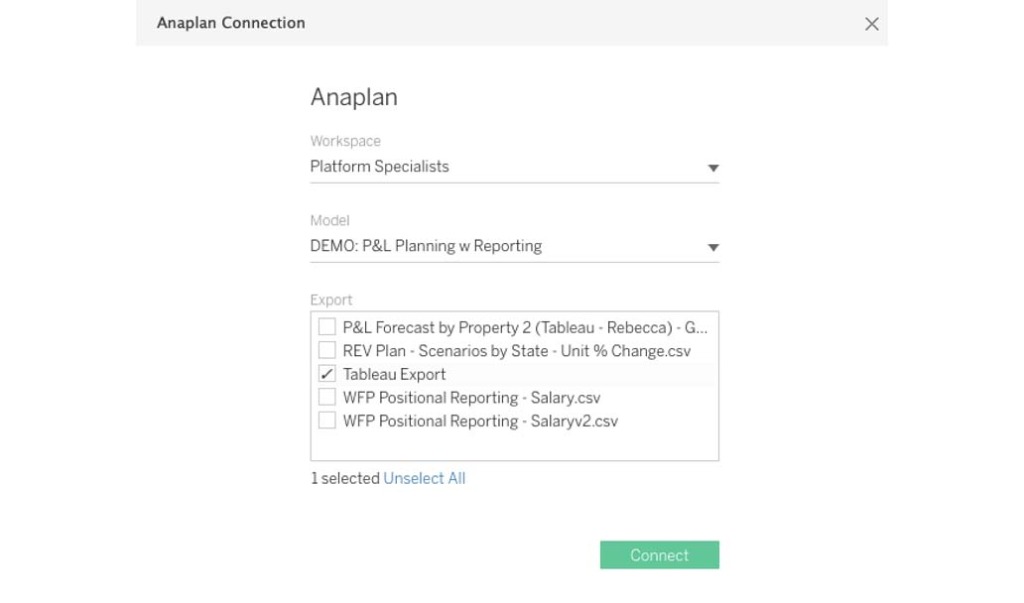
Just like that, Anaplan is now connected to Tableau. Before you begin to create any visualizations, attributes in Tableau are defaulted to ‘string’ data type. Attributes that are date or number formatted in nature within Anaplan will need be converted as such in Tableau. Once the data is groomed, you are ready to build out visualizations!
3. Analyze and Visualize
The connection is ready to go! Use your Tableau expertise to create meaningful visuals that integrate your Anaplan data with your firm’s Tableau reporting.
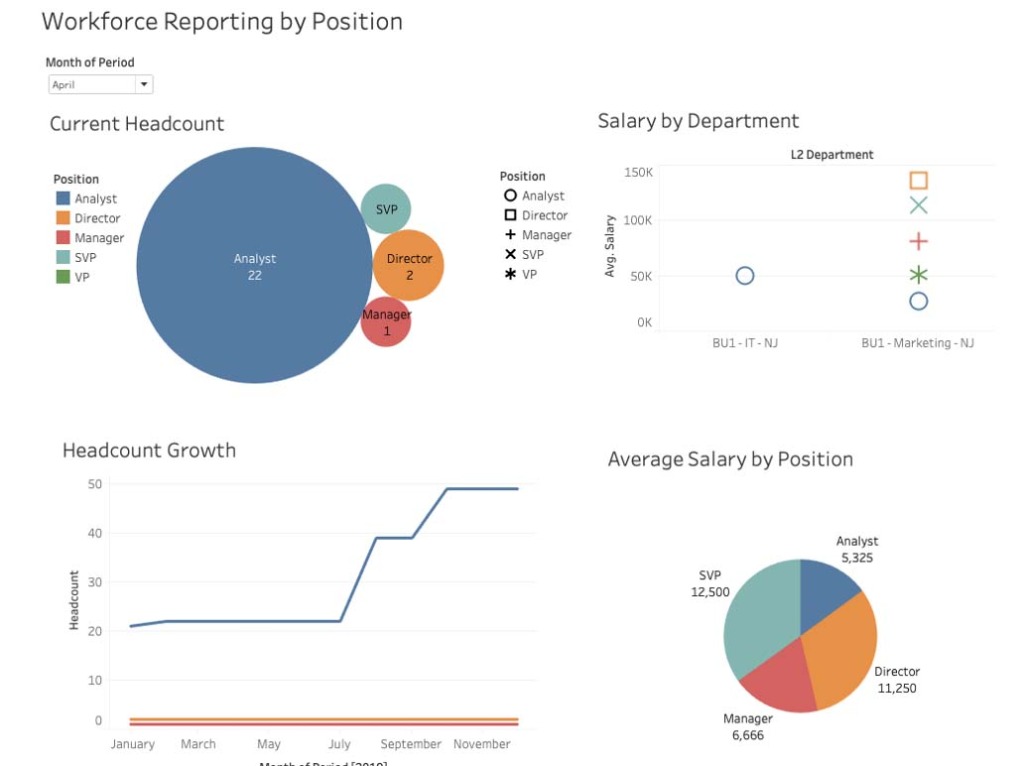
When and if the data updates in Anaplan, Tableau visualizations can easily update with a refresh of the data source, which makes the unity of the two platforms robust. This suite of technologies can accelerate decision making and help organizations better understand their data.
About the Author