The Accordion view
Fundamentals continue to show resilience, with leveraged loan issuers and business development company (BDC) portfolio companies reporting revenue and earnings growth with unchanged interest coverage levels versus prior quarters. The new issuance market continued its strong performance into Q2 2024, with leveraged loan and high-yield bond issuance through the first half of the year tracking well ahead of 2022 and 2023 levels. This allowed borrowers to push out near-term maturities and reprice legacy higher-cost debt, having a positive impact on liquidity.
Against this backdrop, credit distress measures continue to increase. Default rates in leveraged loans and BDCs (using non-accruals as a proxy) both increased quarter-over-quarter, as did the leveraged loan distress ratio (measuring the percentage of loans trading below 80% of par), with loan downgrades continuing to outpace upgrades. Chapter 11 filings have surged versus prior years; total chapter 11 filings (including subchapter V) through June represent the fastest start to a year in the last five years, including COVID-impacted 2020.
With continued increases in general distress measures, we expect steady growth in turnaround and restructuring activity. Similar to prior quarters, increases in distress appear to be issuer and industry idiosyncratic and not macro-driven. Rate cuts in 2024 (if the Fed decides to make any) may modestly supplement individual company liquidity positions, though they are unlikely to act as a trigger that forestalls impending distress given their currently modest projected size and lag in timing of impact.
Quarterly topical: The return of deal volume
After a lackluster 2023, M&A and PE deal activity looks to be experiencing a modest recovery—and debt markets are open for business. Through June, Pitchbook estimates North American M&A deal value totaled $879B, up 9% from the first half of last year, while deal count (estimated at 8,889 deals) is up 6% versus the same period. Similarly, North American PE deal activity (estimated at 4,210 deals) is up 9% versus the first half of 2023 with modestly lower deal value. Though deal value on both fronts remains well below 2021/2022 levels, major investment banks are cautiously optimistic of both capital markets and M&A recovery—and potential rate cuts may act as an accelerant for a further rebound, whether due to the rate cut itself or the sentiment it solicits.

Figures 1 and 2. Source: Pitchbook. North America only.
Leveraged loan and high-yield bond markets are off to a red-hot start for the year, with issuance driven in part by favorable borrowing spread movements. Leveraged loan spreads ended Q2 2024 at +430 basis points, in line with Q1 2024 though well below the average spread throughout 2023 (+500 basis points). Through June, leveraged loan issuance totals $289B, representing the second-best start to a year since 2020 and almost triple the volume in the first half of 2023. Note, approximately 60% of leveraged loan issuance in H1 2024 was related to refinancings (as opposed to M&A activity), in line with the prior year though a marked difference from 2021 and 2022, when refinancing activity accounted for approximately 30% of volume (M&A accounted for 60%, with 10% related to dividend recaps).

Figures 3 and 4. Source: Pitchbook. North America only.
Credit market update
Leveraged loans & high yield bonds
Leveraged loans (as measured by the Morningstar LSTA LL Index) returned 1.9% in Q2 2024, the lowest return since Q3 2022. In a shift from prior quarters, higher-rated credits outperformed lower-rated credits in a modest flight-to-quality—the BB Index returned 1.8% while the CCC Index returned 1.2%. High-yield bonds (measured by the Morningstar US High-Yield Bond Index) returned 1.1%, down from the prior quarter (1.5%) and the lowest quarterly return in four quarters.
As discussed in our Quarterly Topical, issuance volume in H1 2024 was strong off back-to-back robust issuance quarters. Leveraged loan issuance totaled $145B in Q2 2024, modestly higher than the prior quarter ($143B), while high-yield bond issuance totaled $76B (versus $85B in the prior quarter, a three-year record). Robust issuance thus far into 2024 has driven significant progress on the 2025/2026 maturity wall. As of the end of Q2 2024, approximately $37B of leveraged loans were due 2025 or sooner, down 60% from year-end 2023, while $90B is now due in 2026—down 50% from year-end 2023.
In terms of distress and default activity, the leveraged loan LTM default rate (including distressed exchanges) ended Q2 2024 at 4.3%, modestly higher than the prior quarter at 4.2% though well above the 1% levels in 2022. The leveraged loan distress ratio (measuring the percent of loans trading below 80% of par) is 5.6%, up from 5.0% the prior quarter, though still well below late 2022 and 2023 levels (ranging from 8% to 10%). Distressed leveraged loan transactions on an LTM basis are most concentrated in healthcare equipment & services (27% of activity) and SaaS (23%). Loan downgrades additionally continue to outpace upgrades—on a L3M basis, loan downgrades outpaced upgrades by 2.1x, up from 1.6x the prior quarter.
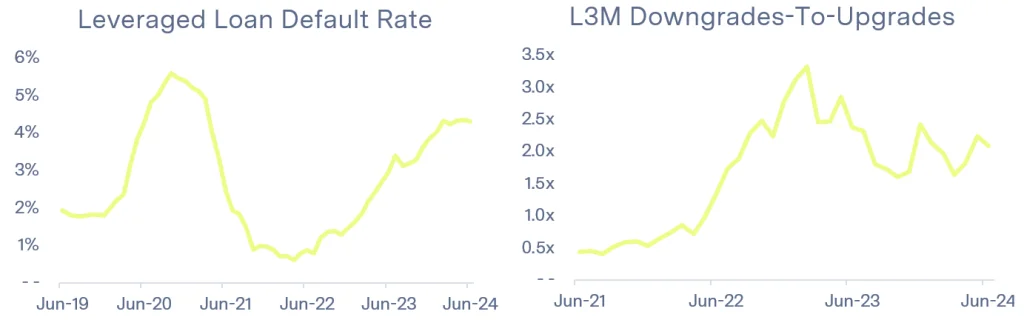
Figures 5 and 6. Source: Pitchbook LCD. Leveraged loan default rate on an LTM basis and includes distressed exchanges.
Private credit (BDCs)
As with prior quarters, BDCs continue to report healthy underlying portfolio company fundamentals. Revenue and earnings show sequential growth, and underlying portfolio interest coverage (as discussed in our prior Q1 2024 Market Update) is generally flat and looks to have troughed as rates have remained stable.
- Ares Capital Corporation (ARCC) reported weighted average LTM EBITDA growth of 12%, up from 10% the prior quarter. Weighted average interest coverage for the portfolio was also flat quarter-over-quarter at 1.6x.
- Blue Owl Capital Corporation (OBDC) reported “steady revenue and EBITDA growth across portfolio companies,” with underlying portfolio interest coverage flat quarter-over-quarter at 1.6x.
- MidCap Financial Investment Corporation (MFIC) reported portfolio weighted average interest coverage of 1.9x, in line with the prior four quarters. On a median basis for the prior quarter, portfolio company revenue and EBITDA both increased by mid-single digits year-over-year.
- Goldman Sachs BDC Inc. (GSBD) reported underlying portfolio weighted average interest coverage of 1.5x, flat quarter-over-quarter with weighted average quarter-over-quarter and year-over-year revenue and EBITDA growth in their portfolio.
- The Golub Capital Altman Index (GCAI), measuring median revenue and earnings growth of 110-150 private middle market companies in the Golub Capital loan portfolio), reported 7% year-over-year revenue growth and earnings growth of 11% led by strong performance in the industrials and technology sectors.
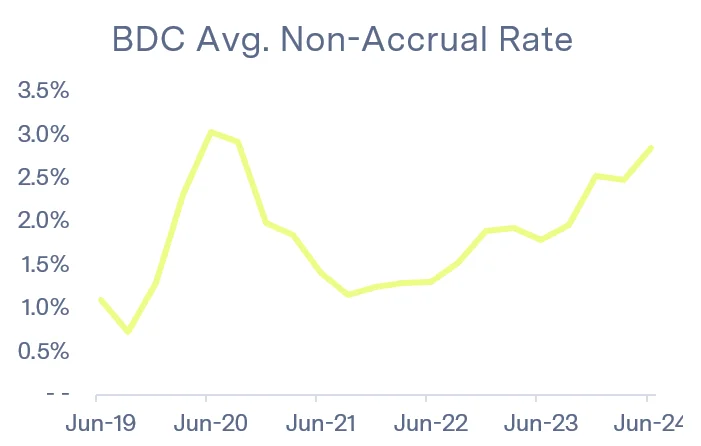
Though fundamentals continue to look healthy, non-accrual (default) rates in BDC portfolios continue to trend higher and are approaching 2020 levels. On average across seven large-cap BDCs, non-accruals represented 2.8% of the portfolio at cost, up from 2.5% the prior quarter and now only slightly below the COVID-era peak of 3.0%. Interestingly, however, earnings call commentary continues to suggest only modest amendment activity.
Bankruptcy & restructuring
Bankruptcy activity continues to increase, both when compared to the prior quarter and the prior year. Commercial Chapter 11 filings totaled 1,659 in Q2 2024, an increase of over 20% versus both Q1 2024 and Q2 2023—representing the highest level of Chapter 11 filings since Q2 2020, at the heart of COVID-19 impact. Subchapter V filings showed a similar trend (up quarter-over-quarter and year-over-year). Notably, subchapter V filings in Q2 2024 (637 filings) represent the highest quarter of filings since its creation in 2019, likely due to filings in anticipation of the expiration of the $7.5M debt limit under the CARES Act, which reverted to $3.0M in June 2024 after Congress failed to pass a widely supported extension.

Figure 8. Source: Epiq Bankruptcy Analytics.
Comparing Chapter 11 activity in total (inclusive of Subchapter V) shows a surge in filings through the first half of the year. With 4,197 total Chapter 11 filings through H1 2024, the current year represents the fastest start to a year in any of the last five years. For reference, total Chapter 11 filings (inclusive of Subchapter V) were 2,977 for the same period last year and 3,611 for the same period in COVID’s 2020.
Unsurprisingly, restructuring activity at boutique investment banks remains elevated versus recent years. Houlihan Lokey (HLI) reported 33 restructuring fee events in Q2 2024, down modestly versus the prior quarter though up from a year ago. With 68 restructuring fee events thus far in 2024, activity is pacing in line with 2023 and ahead of 2020 and 2021.
Through June, Debtwire has reported 1,011 restructuring mandates, down 21% versus the same period in 2023, across 209 companies. Restructuring activity has been most concentrated in healthcare (39 companies), industrial products and services (21), technology (17), and retail (15).
Conclusion
Distress trends from Q2 2024 largely represent a continuation from the prior quarter, with leveraged loan and BDC default rates modestly increasing though still below 2020 and 2021 levels. As a result of strong market issuance, liquidity conditions stand on an improved front versus the prior year, with issuers able to reprice higher-cost legacy debt and make headway on near-term maturities. Distress activity remains likely to be issuer idiosyncratic, though healthcare and software continue to show weakness. Although potential rate cuts in 2024 may modestly improve borrower liquidity positions, we would expect any forward rate cuts this year to have only a nominal effect on general distress and restructuring levels.
Additional sources
- Pitchbook LCD
- S&P Capital IQ Pro
- Company earnings call transcripts and presentations
- Debtwire
- Epiq Bankruptcy